Project information
- Category: Development
- Skills Used: Python, GEE, Data Visualization, Animation
- Find Source Code at: Here
Summary:
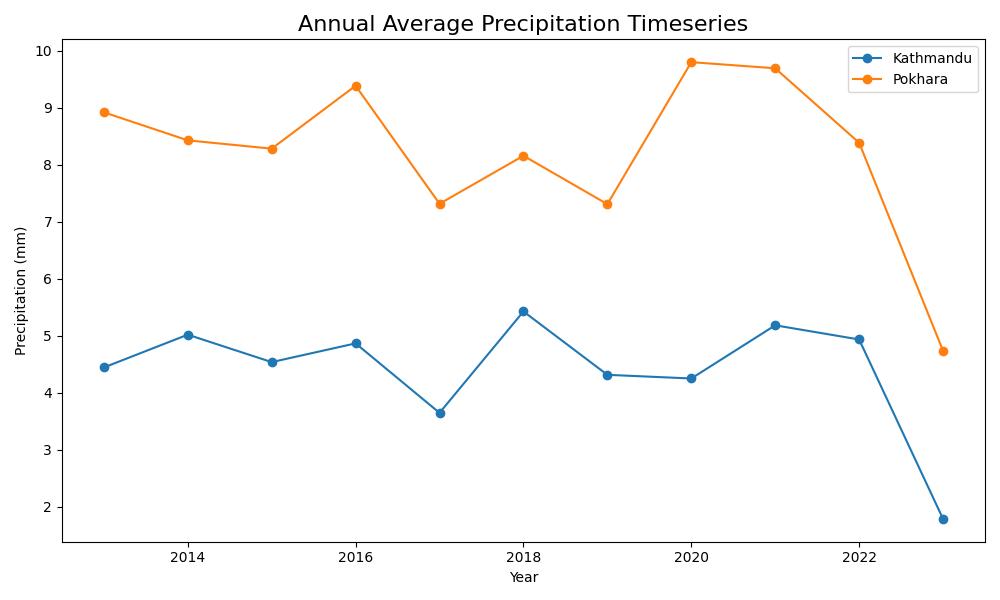
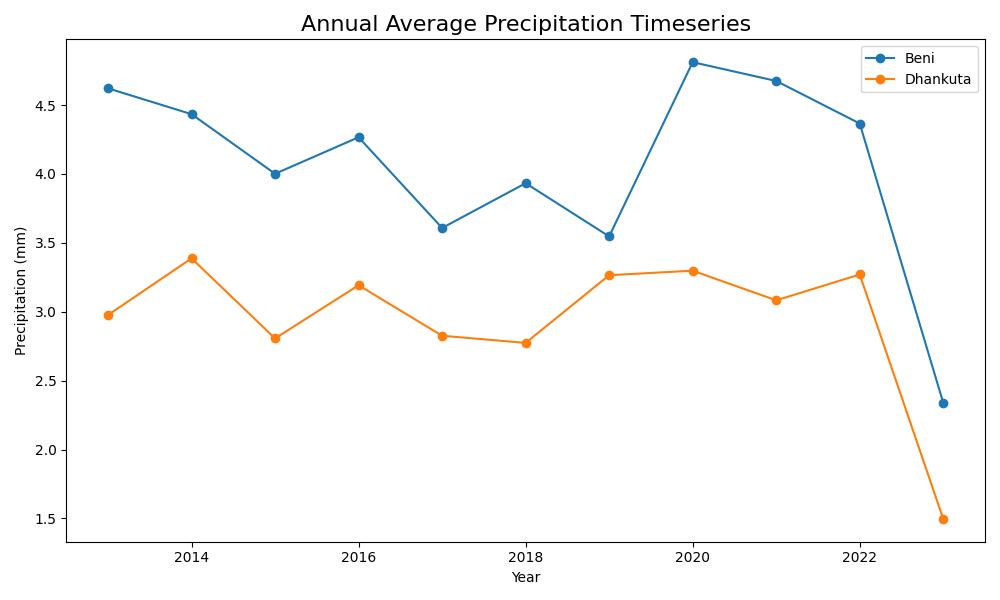
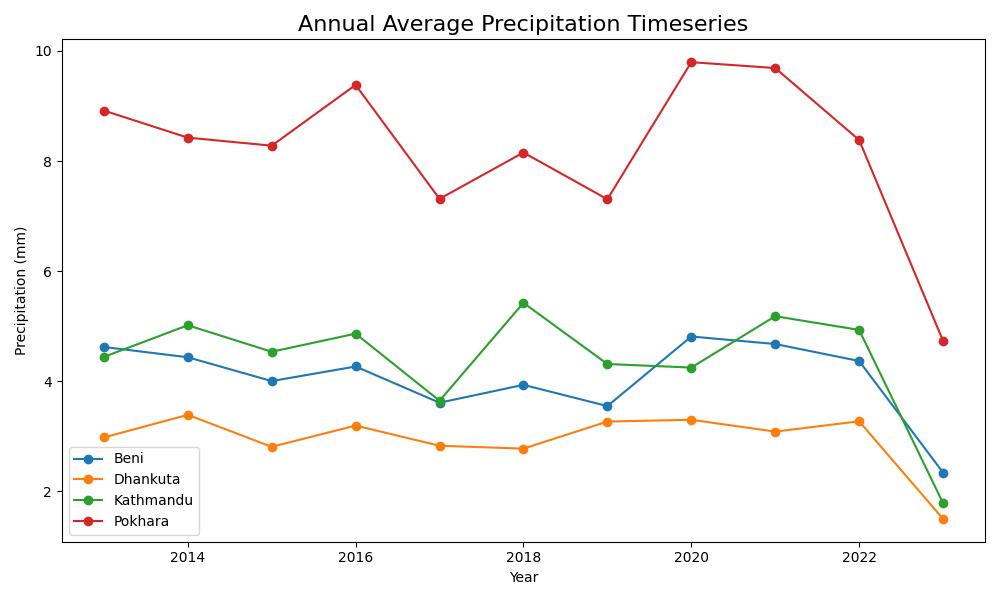
Data is downloaded using GEE. Here we are downloading, cleaning and visualizing precipitation data for multiple places. From daily precipitation data, we calculate the annual precipitaion average for each location for each layer and show plot them against year. Steps: 1. Use the `obtainData.js` script and interactively obtain CHIRPS daily precipitaion data. Mind the naming convention which is `placename_chirps.csv`. 2. Use the `animation.py` to create a _gif_ of time series.


